Global warming might be on hold, but it’s not cancelled
By Iselin Medhaug, 19 July 2016
Research article
Instrumental measurements of surface temperatures are available back to around 1850. Based on these, we can estimate the annual mean global temperature. Global temperatures are clearly rising, mainly because of increasing amounts of greenhouse gases, like for example CO2 and methane, from use of coal, oil and gas and deforestation. Since 1998, a paradox seems to have appeared, where the global temperature has stopped rising even with a steady increase in release of greenhouse gases into the atmosphere. This period has popularly been called the “global warming hiatus” or “paused warming”, and it has been used to cast doubt on whether man made global warming is really happening, or that it can be called off. By using 17 different global climate models, and also available temperature observations, we have tried to figure out why the temperature increase might stop, what is actually happening, whether it has happened before or it may happen again in a warmer world, and which regions have higher chances of experiencing “hiatus” periods lasting for a decade or so.
The greenhouse effect is keeping Earth habitable
Already in 1824, Joseph Fourier [J. B. J. Fourier, 1824] discovered the “greenhouse effect”. Using the distance from the Sun and the size of the Earth, his calculations showed that the amount of solar radiation hitting Earth was not enough to keep the Earth as warm as it is. It should be a lot colder (estimated to be around 33oC colder) than observed, implying no life on Earth, at least not life as we know it today. There had to be something keeping the Earth warm. This “something” is what we now call the greenhouse effect, acting as an insulating blanket around the planet. As a continuation of this, John Tyndall in 1861 [J. Tyndall, 1861] and Svante August Arrhenius in 1896 [S. A. Arrhenius, 1896] published scientific articles on how different gases in the atmosphere have the ability to absorb heat, stating that an increase in the concentration of CO2 (and other heat trapping gases and particles) in the atmosphere would lead to increased global temperatures. So far we have seen an increase of around 0.8oC in the global temperature since the observational record started in 1850. We estimate that by 2100 the Earth will warm between 1 and 6oC relative to the temperatures in 1850 depending on the total amount of greenhouse gases we put into the atmosphere by then. This warming doesn’t sound like much, but the temperature difference between the last Ice Age and the present climate is only 5oC. We have to go back more than 3 million years to find a climate that is 2-3oC warmer than it was around 1850.
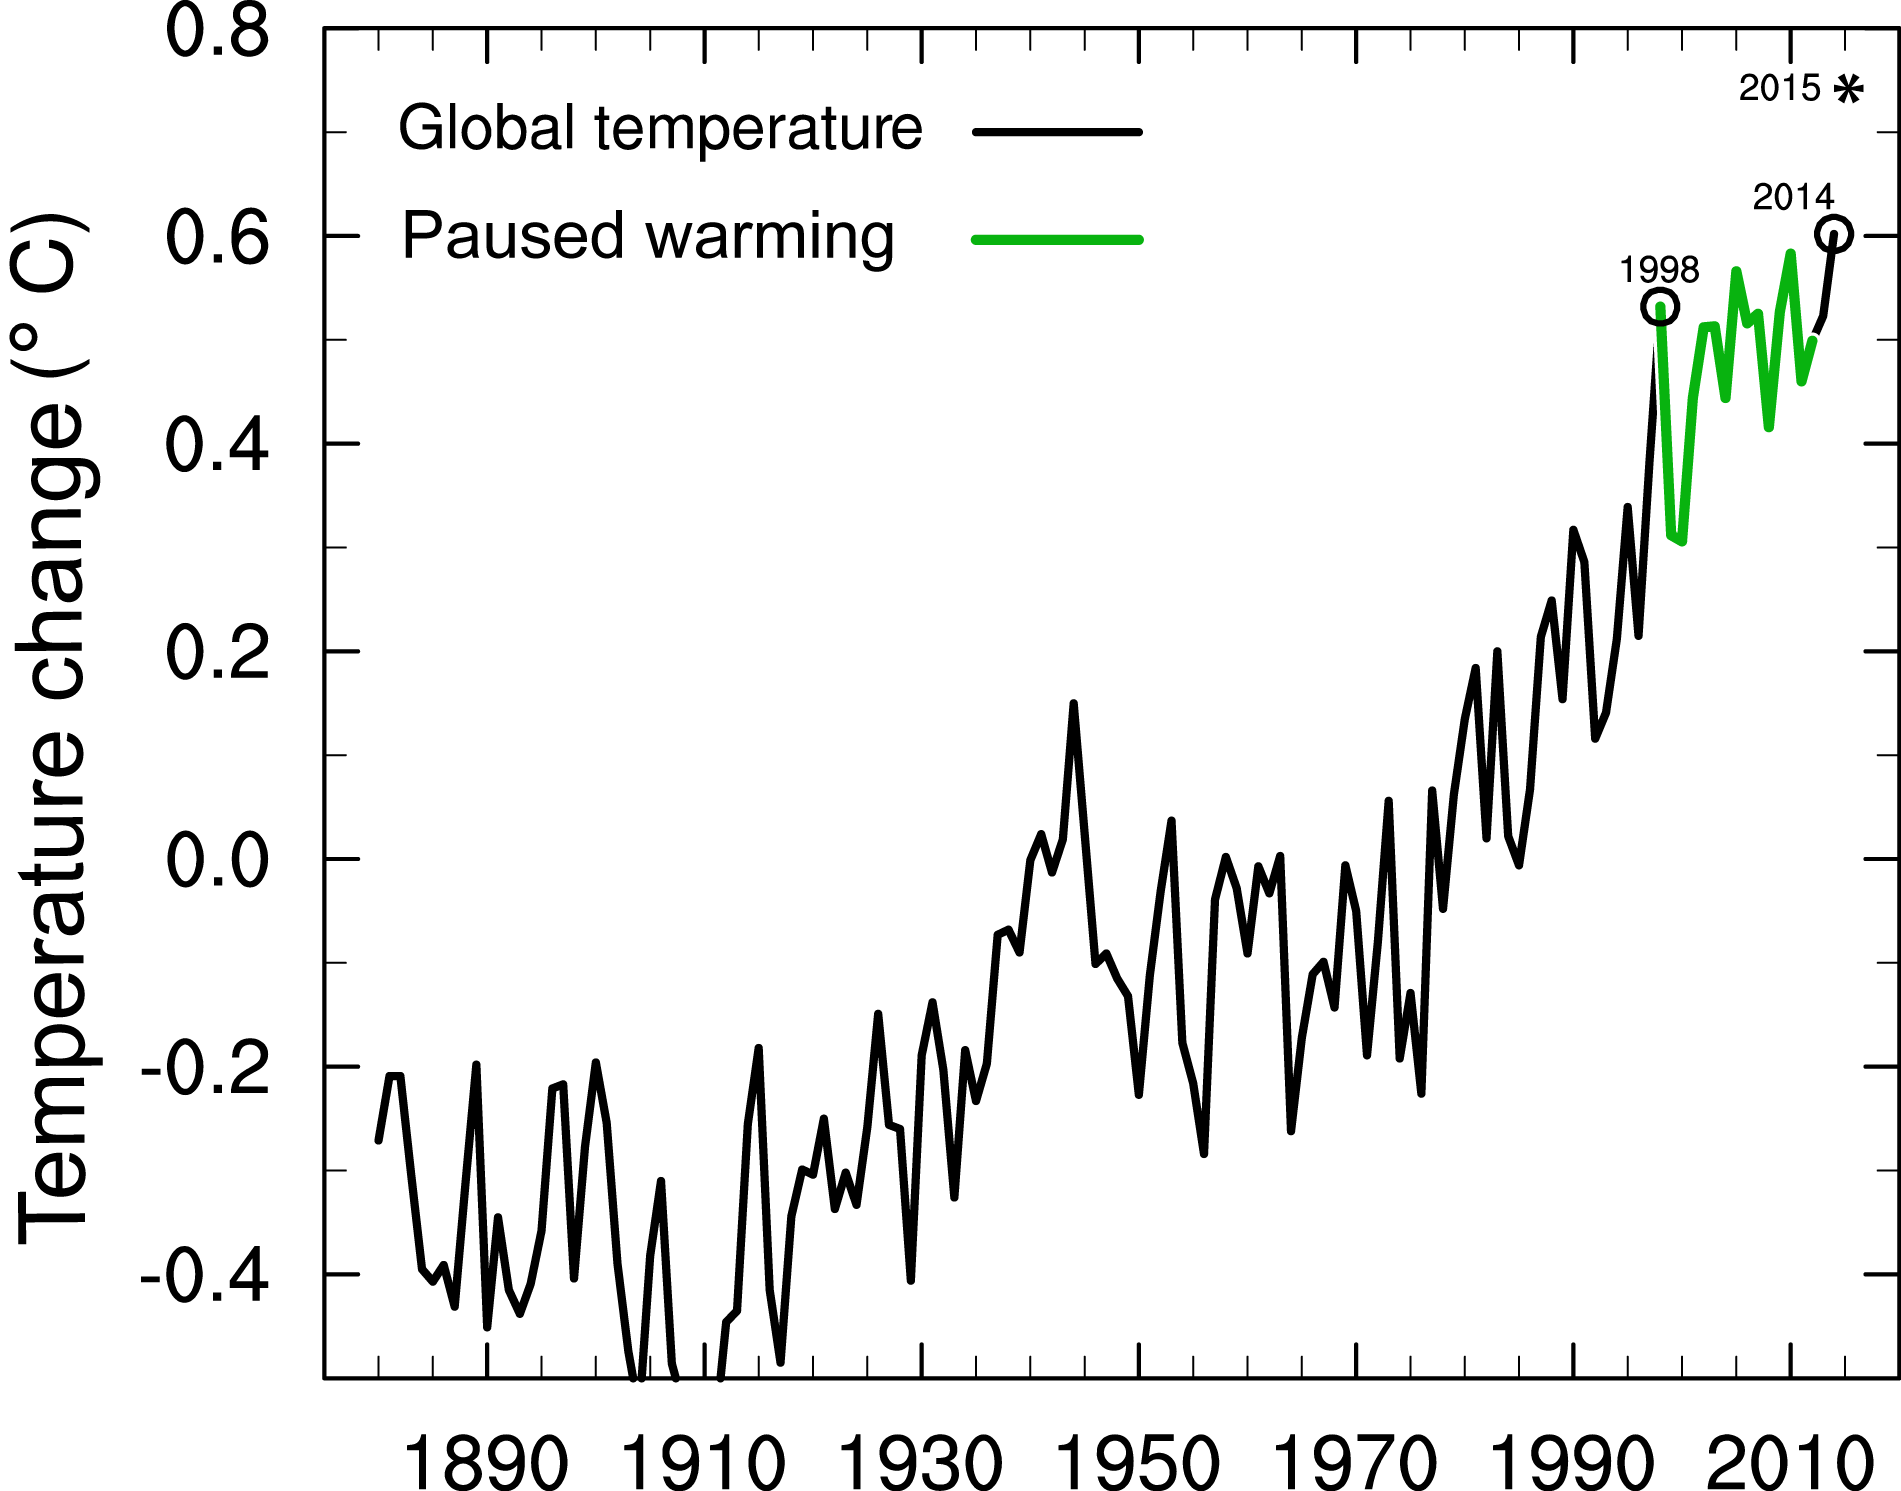
Figure 1. The black line shows the change in measured annual mean global surface temperatures relative to the mean temperature during the period 1961-1990. The green line shows the period referred to as the “paused warming”. * shows the temperature change by end of 2015. Source: Helge Drange/University of Bergen.
In 1979, Jule Gregory Charney and a group of colleagues [J. Charney et al., 1979] found that even when we have a global warming, the global temperature will not increase year by year, but will vary around a gradual, long-term warming. You can see this in the first figure, where there are rarely two years in a row where temperatures increase despite an undeniable long-term warming. Short-term variations like these can be due to variations in the amount of solar heating (or more heat reflected back to space from the surface or cloud tops) or ash from volcanic eruptions reflecting solar radiation back to space and acting to cool down the surface temperatures for a couple of years.
The ocean can even cause longer periods of paused warming. There are two reasons for this. One is that the ocean has a higher heat capacity than the atmosphere, which means that you need much more energy to heat up a liter of water than a liter of air by one degree. The second reason is often called “natural variability”. This is when the ocean absorbs heat at the surface, and brings this heat to the deep abyss as the water circulates the world oceans. This heat can be stored in the deep ocean for decades or more before it is brought to the surface again and released to the atmosphere. So by only measuring the temperature at the surface of the Earth, we don’t capture what is going on in the deep ocean or high up in the atmosphere.
Some people argue that climate models are unfit for the task of saying anything about the observed pause in global warming due to the failure of predicting it in advance. This is not necessarily the case. Climate models are replicas of the climate of the Earth, but they generate their own natural variations, and these variations might not coincide in time with the same variations in the real climate. The global warming that is in addition to these variations are on the other hand the same. However, if we search for periods in the models where this type of paused warming occurs, we can compare these to the observed periods and potentially understand what is happening and why.
A paused global warming has happened before and it will happen again
Based on the observed temperature, we find that periods of paused warming actually happen more often than we might expect. If you pick random, 10 year long periods from observed temperature since 1910, approximately every third pick would be a period without warming, despite an undeniable long-term warming. If we do the same exercise with temperature taken from global climate models, we get almost the same number. Paused warming periods are therefore simulated in climate models, just not necessarily at the same time as in observations. These paused warming periods will still occur in the future with increasing temperatures, but not as often and maybe not lasting as long as today.
Climate models are unique in that they allow us to do experiments in order to learn how the climate of the planet works. Such experiments are, obviously, impossible to do in reality. So, if we run the climate models without putting the extra greenhouse gases into the atmosphere, we will pick paused warming periods half of the time. This is exactly what we would expect for a planet that isn’t warming, a warming period is as likely as a cooling period. When we put greenhouse gases into the atmosphere and the planet warms, paused warming periods occur less often because the cooling needs to overcome the steadily increasing temperature. Imagine two kids on a seesaw, like in the top part of the second figure. If the kids have the same weight, and push by the same amount, the kids will spend half of the time above and half of the time below the middle. Now, focus on the one on the right hand side. The kid represents the global temperature, which spends half the time warmer than average and half colder. The weight of the kid on the left hand side represents the greenhouse effect. When the kids have the same weight, the climate system is in balance and we don’t have any long term warming or cooing. If you replace the left hand kid with an adult, like in the lower part of the figure, the weight distribution becomes uneven. The extra weight of the adult represents the global warming. The climate system is no longer in balance, but it’s warming. Now the temperature is not likely to be cold as often, or for as long, because the kid stays higher up for longer. Even if the adult pushes the ground, the kid will likely not reach the ground, or if it does the kid will “fly” into the air. This “flying” illustrates the increasing temperatures due to global warming. If the temperature would increase by for example 0.3oC without global warming, and the global warming over the same period is 0.1oC, the total warming would be 0.4oC (“flying” 0.1oC higher than otherwise). The heavier the grown-up, or the larger the global warming, the harder it is for the kid to reach the ground. If the globe warms up too quickly, the natural occurring temperature variations are too small or short-lived to compensate for the effect of the global warming.
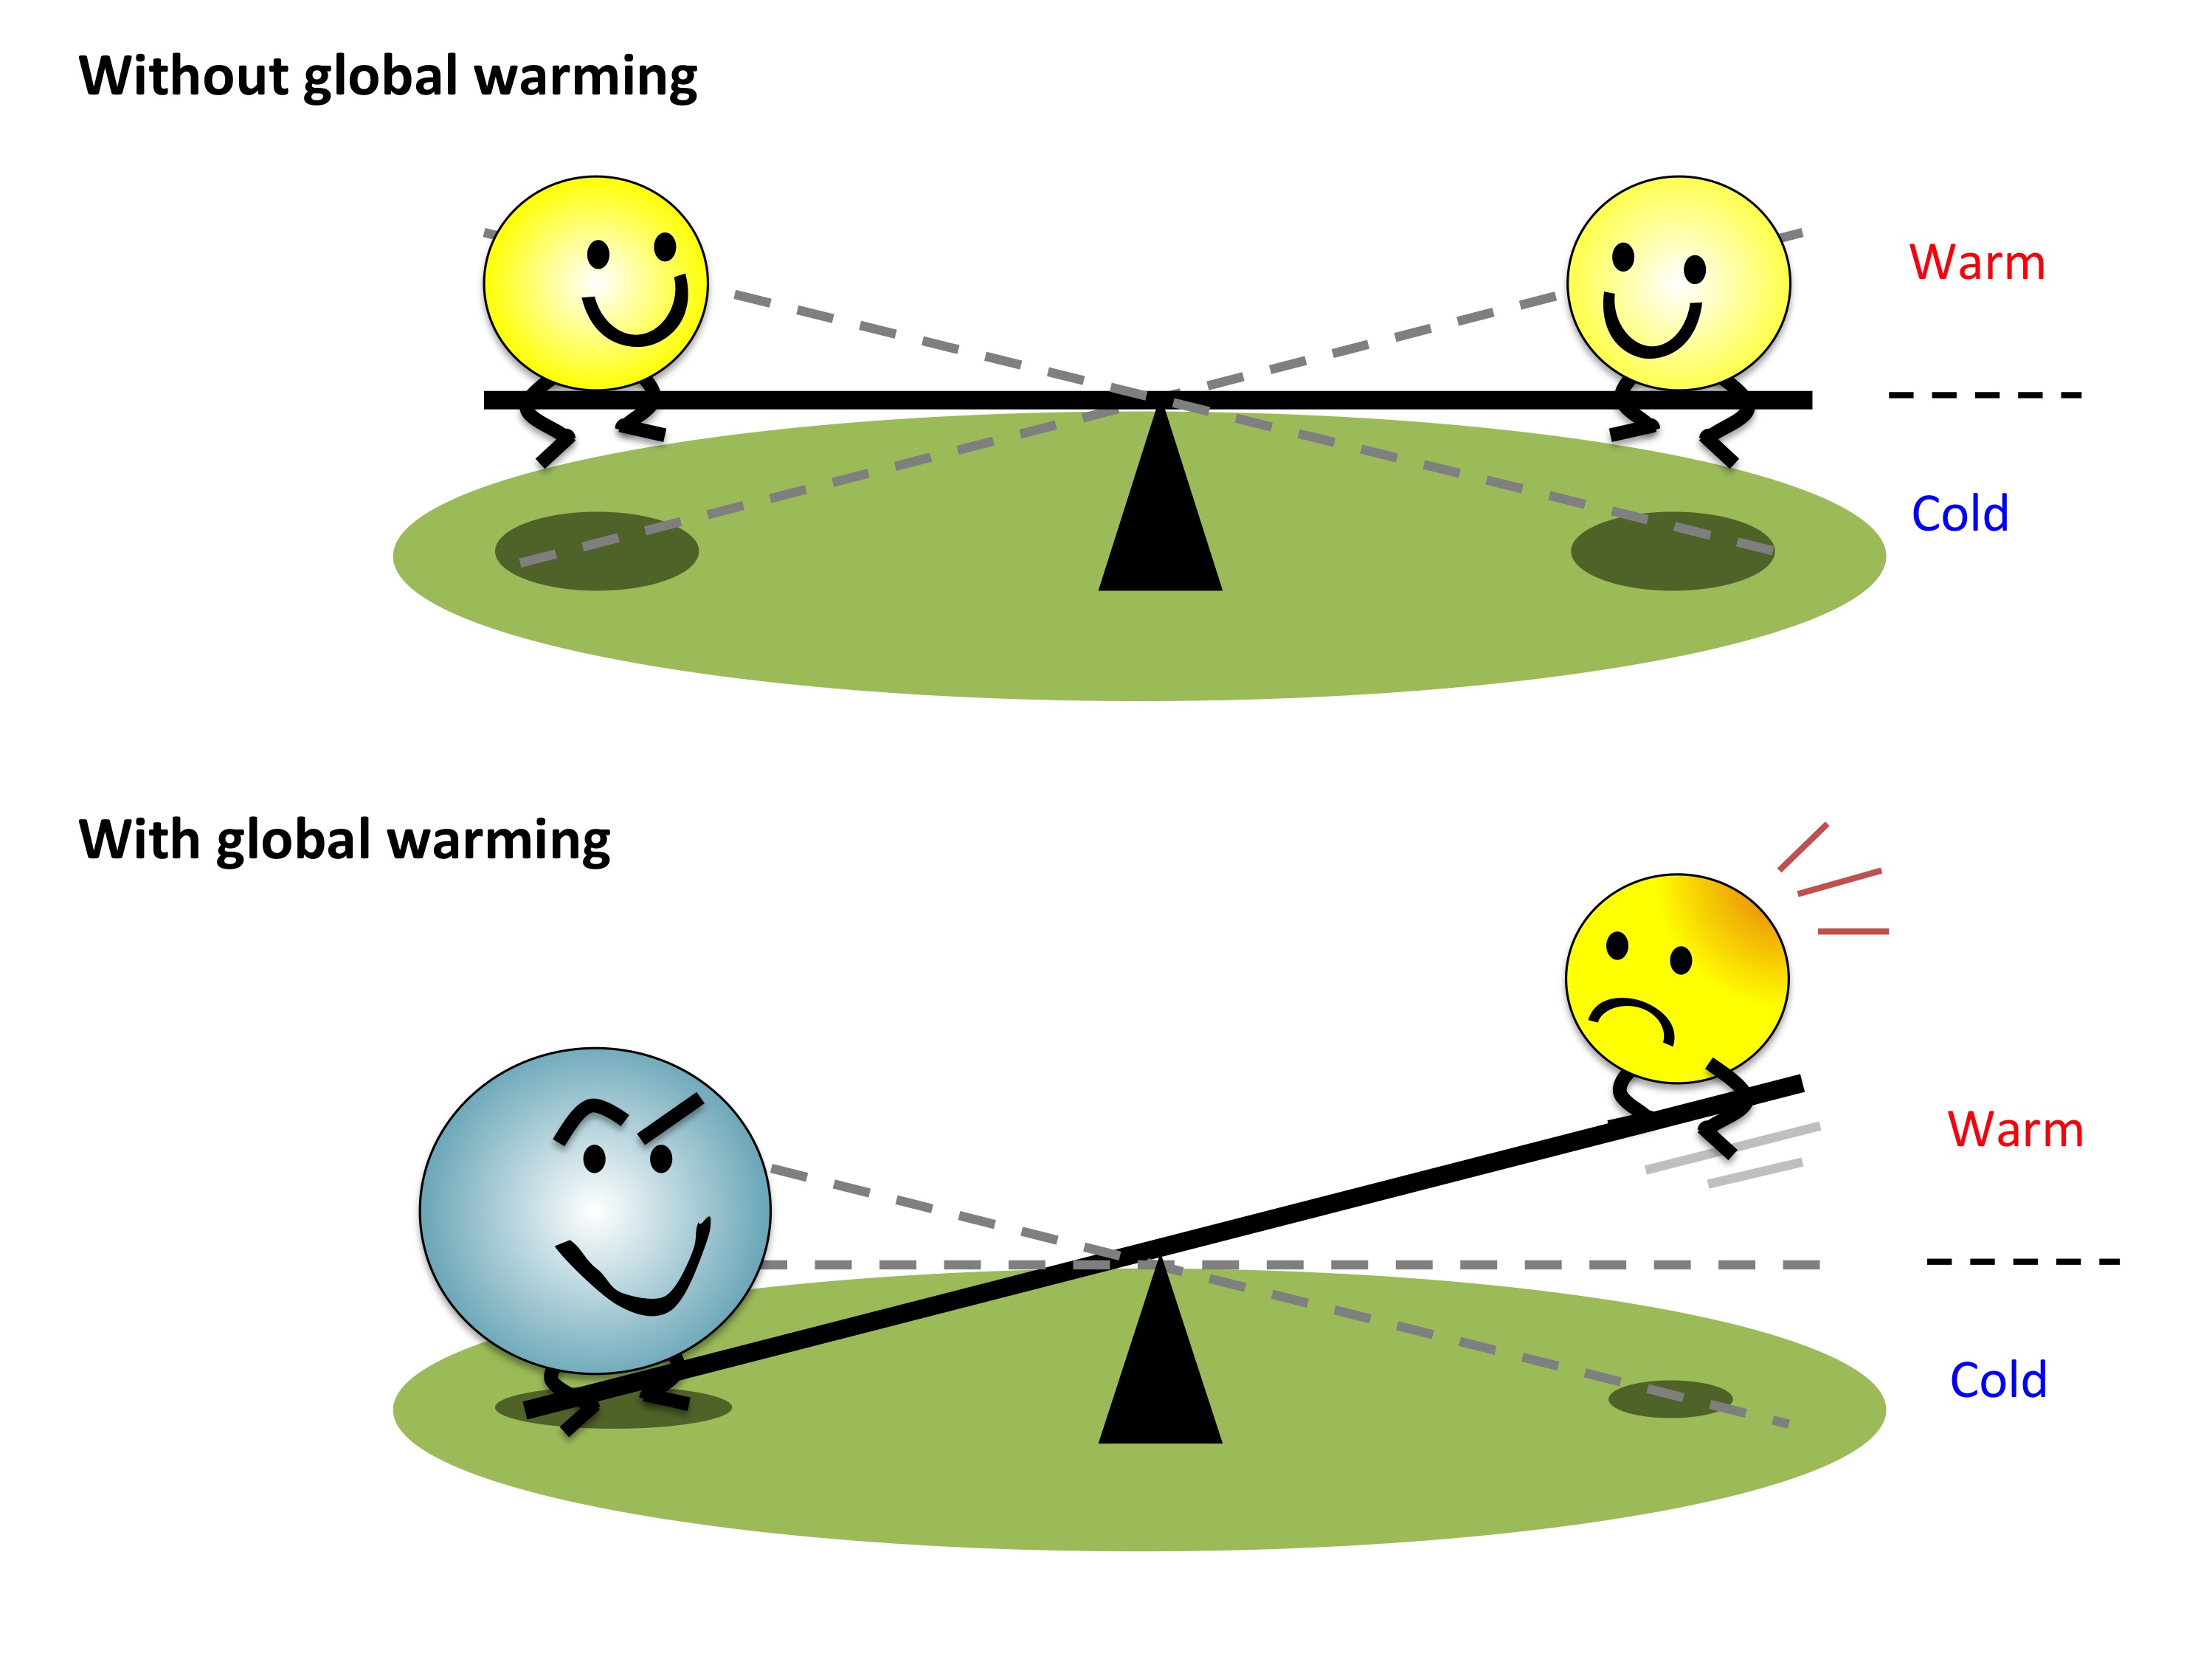
Figure 2. The upper part illustrates a climate system in balance. The kid on the right hand side of the seesaw represents the global temperature, and the weight of the left hand kid represents the greenhouse effect. When the right hand kid is above the middle point, the global temperature is warmer than the mean, and when it is below, it is colder than the mean. The global temperature alternates between the two states, spending around half of the time above and below. The lower part represents the climate system when we have global warming, illustrated by a heavier adult on the left hand side. The weight distribution becomes uneven, and the kid will spend more time in the air, being warmer than normal. It is harder for the kid to now reach ground and be colder than normal the heavier the adult is. This illustrates that it is less likely to get paused warming periods when we have global warming.
The above can also be done locally, where people actually live, not just for global temperatures. We can now pick 10 year long periods at every place on the Earth. Not all places on the Earth will warm equally in the future. The tropics will warm less, and the poles more, compared to the global mean warming. Likewise, land will warm faster than the oceans. If the globe as a whole warms by 2oC relative to the average temperature for the period 1850-1900, the Arctic may warm by more than 10oC and the tropics only by 1oC. There might even be regions experiencing a decrease in temperature because of changes in for example the Gulf Stream, which transports warm water from the tropics towards the north. By changing where the warm water ends up, some regions might be colder than they were. For these regions we can expect to pick a lot of 10 year long paused warming periods. The Arctic is also a special place. Even though we expect a large warming, we still expect to pick a lot of 10 year long paused warming periods because the natural variations are also large. The opposite is the case for the tropics. It will only warm slightly, but the mostly local natural variations are also small in comparison. So, different regions contribute differently to the global temperature because the amount of warming and the natural variations vary regionally.
The oceans are slowing down the surface warming
Several reasons have been proposed to explain periods of paused warming. Satellites measure how much solar radiation is coming from the Sun and how much heat is lost to space from the Earth. These observations show that the Earth receives more heat than it loses. We would therefore expect the surface temperatures to increase, not decrease. This rules out the Sun as a cause for the recent paused warming, and also indirectly the volcanoes, which would be picked up by the satellite measurements. Since we don’t see higher temperatures on the Earth’s surface, the heat that the Earth receives must be hiding somewhere in the climate system. To find out what is happening, we should ideally have observations of every location around the world, over the full depth of the ocean and the full height of the atmosphere, for a long period of time. Unfortunately, we don’t.
But fortunately, the climate models come to our aid. One great aspect with climate models is that heat can’t hide anywhere because the model generates “observations” everywhere, in the oceans, on land and in the atmosphere, at all times. All changes in temperature and heat and other properties can be checked, like the amount of solar radiation reaching the outer part of the atmosphere or hitting the Earth’s surface, the amount of greenhouse gases in the atmosphere, the number and strength of volcanic eruptions and changes in the vegetation. This gives us a fantastic possibility to check and see where the heat is hiding. Afterwards we can then check whether our findings from the models are plausible also in reality, using real observations.
We have used 17 different climate models that are all based on physical equations of how the Earth’s climate works: how low and high pressure systems move around; how the ocean and atmosphere take up and exchange heat; how sea ice melts and freezes; and how the Gulf stream moves heat from the warm tropics to melt sea ice in the cold Arctic and more. What they have in common is that when paused warming periods occur in the climate models, the tropical Pacific Ocean sea surface is colder and the deeper part of the ocean is warmer than usual. In this way, the sub-surface waters in the Pacific Ocean can store large amounts of heat. The way the ocean manages to do this is by the help of the atmospheric winds above.
In the tropics the wind blows from east to west, pushing the water in front of it in the same direction. Because of the rotation of the Earth, the water at the surface will move slightly northwards north of the equator, and slightly southwards south of the equator. So, the winds act like a snow-plow along the surface, leaving a wake behind it, which has to be filled. The wake is filled by colder water from deeper down in the ocean. If the winds are stronger than usual, more of this cold water reaches the ocean surface, leading to surface cooling. Since the area of the tropical Pacific Ocean is so big, the surface cooling leads to a lowering of the temperature at the Earth’s surface. When the opposite is true, with weaker than usual winds, less of the cold sub-surface water will reach the ocean surface. This leads to a warmer than usual ocean surface, and by that a warmer surface of the Earth as a whole. These variations are known as La Niña (when the ocean surface is unusually cold) and El Niño (warm surface ocean), or more general the Pacific Decadal Oscillation if we look at the whole Pacific and on longer time scales, and not just the tropical region.
Can we observe what the models tell us?
Indeed, what the models show can also be seen from available observations. In 2013, Kevin E. Trenberth and John T. Fasullo [K. E. Trenberth and J. T. Fasullo, 2013] published a scientific article where they compared observations of the surface temperature between two periods: A period with strong surface warming (1976-1998) and a period without surface warming (1999-2012). Interestingly, their findings show exactly what the models show: During the paused warming period, the tropical Pacific Ocean was unusually cold due to stronger than normal winds blowing over the ocean, pushing more water away from the South American coast, leading to upward motion of cold, sub-surface water.
In short, it is too early to call off the global warming just yet. Depending on the amount of greenhouse gases we put into the atmosphere, the planet as a whole will still warm, and 10 year periods of paused surface warming might still happen. During these periods, it is likely that the Pacific Ocean hides the heat from being visible by the atmosphere. This hiding game will not last forever, and when the heat reaches the ocean surface, the Earth’s surface temperature will increase again, like in the past. With increased global temperature as a result of continued release of greenhouse gases to the atmosphere, paused warming periods will occur less often and become shorter in duration, but they will nevertheless occur.
- S. A. Arrhenius: On the Influence of Carbonic Acid in the Air upon the Temperature of the Ground, London, Edinburgh, and Dublin Philosophical Magazine and Journal of Science, vol. 41, 237-275, 1896.
- J. Charney, A. Arakawa, D. Baker, B. Bolin, R. Dickinson, R. Goody, C. Leith, H. Stommel and C. Wunsch: Carbon dioxide and climate: a scientific assessment., National Academy of Sciences, The National Academies Press, Washington D.C., USA, 1-22, 1979.
- J. B. J. Fourier: Remarques Générales Sur Les Températures Du Globe Terrestre Et Des Espaces Planétaires, Annales de Chimie et de Physique, vol. 27, 137-167, 1824.
- K. E. Trenberth and J. T. Fasullo: An apparent hiatus in global warming, Earth’s future, vol. 1, 19-32, https://doi.org/10.1002/2013EF000165, 2013.
- J. Tyndall: On the Absorption and Radiation of Heat by Gases and Vapours, and on the Physical Connexion of Radiation, Absorption, and Conduction, Philosophical Transactions of the Royal Society of London, vol. 151, 1-36, 1861.
