|
Dear Reader, Welcome to our first newsletter! With this newsletter we would like to bring you the latest news about Climanosco and share with you our 3 Minutes Digests that were posted on Facebook since the start of this project. What's more, we are delighted to thank ClimateSnack and to introduce some of our members. Let us furthermore draw your attention on our Survey which just opened up. Be the first to tell us how you feel about climate, climate science and Climanosco! Good reading, Your Climanosco -Team
|
|
|
|
Launch Challenge, Nov 4 - present
We are excited to announce that twelve bright early-career climate scientists from around the world are participating to our Launch Challenge. In their manuscripts, the authors discuss the state-of-the-art climate science in non-scientific language on hot topics including Greenland ice sheet, solar variability, El Niño, natural variability, heat waves, flash floods, climate and air quality among others. Join the discussions and bring your own perspective!
|
|
Crowdfunding, Sept 15 - Oct 15
We are delighted to share with you the success of our first Crowdfunding adventure on Indiegogo.com. The campaign allowed us to raise our first money and will help us bring Climanosco to the next level over the coming year. We are very thankful to all our supporters who helped spread the word and generously donated for Climanosco. A huge thank you to everyone!
|
|
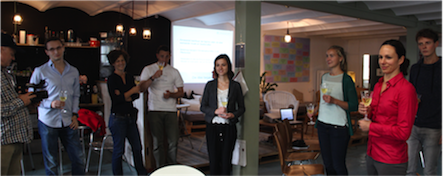
Launch Event, Sep 17
We celebrated the launch of our activities in mid-September in Zurich. It was wonderful to meet many members, including some new faces of Climanosco, and to present our initiative at this occasion. We also had the great pleasure to introduce the artists duo Barbara Glazar and Ryan James who support Climanosco with their painting Deep Into This Light.
|
|
3 Minutes Digest, Aug 25 - present
3 Minutes Digest is a project started end of August on our Facebook page. Posts that are readable in about three minutes bring published articles in the area of climate sciences to the general public in an easily digestible phrasing. Join the 3 Minutes Digest Group by contacting us and start getting involved!
|
| |
 |
|
Launch Event, Zurich, Sep 17, 2015
|
|
What drives the South Asian monsoon?
|
|
The South Asian monsoon is a unique weather pattern that brings important amounts of rain to the Indian subcontinent every year from June to September. Until quite recently it was taken for granted that the phenomenon was simply caused by a faster warming of the land with respect to surrounding sea during summer. While warm air rises over the continent, moist air is dragged from the nearby Indian Ocean. This would trigger heavy rains. The monsoon was thought to be intensified by the Tibetan plateau, an area of 2.5 million square kilometres at an average altitude of 5,000 meters that lies north of India. This large and elevated surface is warmer than the free atmosphere anywhere at the same altitude, which would enhance the continental heat source and ultimately the intensity of rains.
But our understanding of the monsoon reshaped significantly over the past decade. In their 2010 Nature paper, Bill Boos and Zhiming Kuang re-evaluated the hypothesis that the Tibetan plateau intensifies the monsoon. They used a computer climate model to perform a simple but clever experiment. They removed the Tibetan plateau from their computer model, but they kept its southern edge in the form of a thin and high mountain range (essentially the Himalayas). The intensity of the monsoon they obtained was very close to that found with the full Tibetan plateau. Hence, the large plateau and its heat source for the atmosphere is not what predominantly intensifies the monsoon. In contrast, they argued, the high mountains act as a barrier preventing moist tropical air to mix with colder and drier air from the north.
By revising the role of the Tibetan plateau, this work contributed to correct the picture we have about the South Asian monsoon. Recently novel mechanisms have been proposed to explain the intensity of the monsoon, without primarily relying on a giant sea-breeze circulation that would result from the differential heating between the land and the sea. These alternative theories, and ongoing debates among climate scientists, will be the subject of future "3 minutes digest" posts.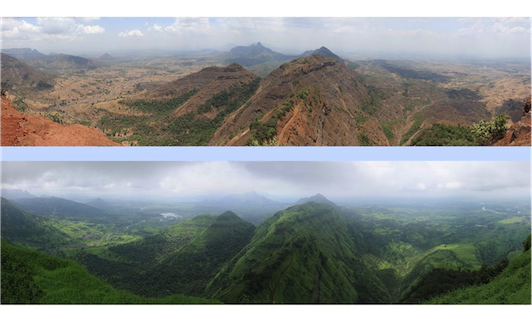
Farid Ait-Chaalal, Nov 2, 2015
Reference: William R. Boos & Zhiming Kuang, 2010. Dominant control of the South Asian monsoon by orographic insulation versus plateau heating. Nature 463, 218-222. http://www.nature.com/.../nature08707.html
Picture: Western Ghats on May 28 2010 (top, dry season) and on September 28 2010 (bottom, wet season). From wikipedia: https://en.wikipedia.org/wiki/Monsoon
|
|
Air pollution, climate and health
|
|
Air pollutants such as ozone and particles suspended in the air (we call them aerosols) make an important contribution to the climate, locally, especially in large cities but also globally. In addition to these climatic impacts, air pollutants have direct harmful effects on our health, with their long-term effects leading to premature deaths. The concentrations of ozone and aerosols around the globe are very variable, in contrast to greenhouse gases like carbon dioxide. This makes it more difficult to evaluate their climatic and health impacts. Our knowledge is especially limited in regions where a long-term monitoring of air pollutants is lacking. To fill the gaps in these regions of the world, scientists often use computer models based on our best knowledge of physics, chemistry and the emissions inventories. Scientists compare these model calculations with all available observations in order to evaluate their accuracy.
In a recent study (Lelieveld et al., 2015), scientists evaluated the premature deaths caused by ozone and fine particles (PM2.5, smaller than 2.5 micrometer). In this study, authors combined for the present-time (2010) the concentration of air pollutants computed using a global model with population data, country-level health statistics and exposure-response functions. Authors found that air pollution (mostly PM2.5) causes more than 3 million premature deaths every year worldwide with major hotspots over South and East Asia. Deaths due to air pollution over East Asia are found to be much more frequent than that associated with road-transport injuries and HIV/AIDS. They highlighted that the air pollution has become one of the top cause of today's premature deaths. Authors made further calculations for the future years 2025 and 2050, assuming a Business-as-Usual scenario including currently agreed legislations on air pollution. They found that premature deaths caused by air pollution may double in 2050 with respect to present-time.
Narendra Ojha, Oct 28, 2015
Reference: J. Lelieveld et al., 2015. The contribution of outdoor air pollution sources to premature mortality on a global scale. Nature 525, 367-371. http://www.nature.com/.../nature15371.html
|
|
Readability of IPCC reports
|
|
The Intergovernmental Panel on Climate Change (IPCC) is the scientific intergovernmental body mandated by the United Nations to produce reports on the state of scientific knowledge on climate change. Such documents were released in 1990, 1995, 2001, 2007 and 2014. Each time, they consists in four parts which compile relevant information related to climate change in terms of (1) the scientific basis, (2) the impacts, the adaptation and the vulnerability, (3) the mitigation and (4) a synthesis. These documents are long and complex. Therefore, the IPCC produces shorter reports called the Summaries for Policymakers. They are supposed to be clear and written in a neutral tone as well as to be understood by a non-specialist-audience. Indeed, climate change is a topic that should be comprehended by the world population.
However, a linguistic analysis published in Nature Climate Science* shows that even these summaries present very low readability. Moreover, this study highlights that media (from US and UK), the principal agents of communication towards the population, interpret the content of these summaries in a more emotional and pessimistic tone. Therefore, the authors of this paper recommend that science communicators should participate in the writing of these summaries or that theirs authors should receive science communication training.
Marie Charrière, Oct 15, 2015
Reference: Barkemeyer, R., Dessai, S., Monge-Sanz, B., Renzi, B.G., and Napolitano, G. 2015. Linguistic analysis of IPCC summaries for policymakers and associated coverage. Nature Climate Change. http://www.nature.com/.../nclimate2824.html
|
|
Can't stand the heat?
|
|
Being from Québec, this last winter was sooooo cold!! Where the hell is global warming!?! Pffff..!
We're all expecting higher and higher temperature year after year, where in fact, climate change is only the evolving background state of the climate system. Perhaps more importantly, people do not feel the smooth trend, but rather the year-to-year variation around it. These oscillations are what we call the natural variability of the climate. It can accentuate or hide the background trend of the climate over a relatively short duration at the regional scale. This variability arises from forcings, such as the non-linear interactions between components of the climate system and can be divided into two main categories: internal (e.g. interactions between the oceans and atmosphere) and external forcings (e.g. solar variability).
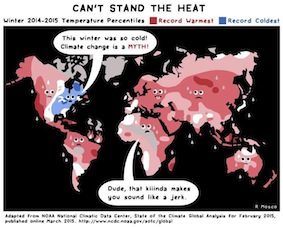
Why is natural climate variability important? It helps to understand hard-to-explain behaviour of the climate. For example, climate skeptics use coldness of the last 2 winters over Eastern North America (2014-2015) as a sign that global warming is not happening (as shown in the "comic" figure). They also use observed cooling trends as another sign that climate is actually cooling. Natural climate variability is part of the answer to those issues.
In a recent paper, Grenier and coauthors (2015) used 60 climate scenarios to estimate the probability of cooling trends under expected CO2 anthropogenic forcings between 2006 and 2035 over Canada. The basic question answered in the paper is: Under a warming climate, what are the chances of having a cooling trend over a short period? Unsurprisingly (at least for climate scientist!), they found that the warming climate is not a linear road, where the mean temperature is always higher year after year. Natural oscillation around a background trend is present. They tested different duration of cooling trends (i.e. what is the probability to have a 10-yr cooling trend?) and they found that the probability of 10 years cooling trends varies across Canada in-between 23%-38%. In other words, climate can be seen as a succession of trends, the positive trends outweighing the negative trends in the end, as highlighted by the following Figure (blue lines being cooling trends and red lines representing warming trends). 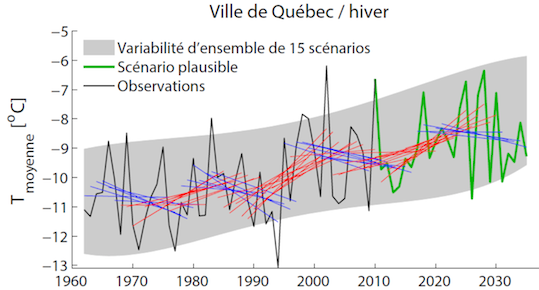
Now, the next time a skeptic tells you that climate change is a hoax because the mean temperature of the Earth is cooling for a given number of years, you'll be able to answer with flying colors!
Philippe Roy, Ph. D., Sep 12, 2015
Reference: Grenier, P., de Elía, R., & Chaumont, D. (2015). Chances of short-term cooling estimated from a selection of CMIP5-based climate scenarios during 2006-2035 over Canada. Journal of Climate. http://journals.ametsoc.org/.../JCLI-D-14-00224.1
Pictures: Can't Stand The Heat Adapted from NOAA National Climatic Data Center, State of the Climate Global Analysis for February 2015, published online March 2015. http://www.ncdc.noaa.gov/sotc/global
|
|
The solar cycle explained
|
|
In a previous post, I presented an article studying the impact of a possible future grand solar minimum on climate. Solar minima are important for our planet, but the normal solar activity is also an interesting topic on its own. The solar cycle usually refers to the variation in the number of dark spots present on its surface (see plot). They are manifestation of the surface magnetic field, which evolves on a time-scale of about 11 years. The large-diameter (typically around 10000 km) concentration of magnetic field blocks the transport of energy to the surface, which make the sunspots appear darker than the rest of the Sun. Other manifestations of surface magnetic field come along with sunspots: they are called faculae. They also are concentrations of magnetic field, though their diameter is much smaller (less than a few hundred kilometers). This difference in size brings a very important change: in that case, the energy is transported more efficiently to the surface. Henceforth, the faculae are brighter than the rest of the solar atmosphere.
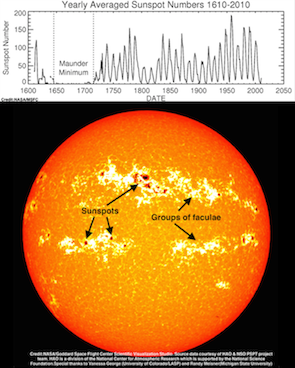
The image shows a tremendous amount of individual bright faculae grouped around dark sunspots. Since the faculae are more numerous when the Sun is more active (as well as sunspots), and their brightness is high enough to over-compensate the local darkening by spots, overall, the Sun is brighter at maximum activity. Its total luminous power, received at the top of Earth's atmosphere, varies by 0.1% over the course of a cycle, but the spectral variations are be much higher (for example, from 1-10% in the near- and mid-ultraviolet). This has a direct impact on our atmosphere.
Cassandra Bolduc, Sep 8, 2015
Pictures: NASA/MSFC, NASA/Goddard Space Flight Center Scientific Visualization Studio
|
|
Snowball Earth
|
|
In science-fiction, habitable planets often host only one ecosystem spanning all latitudes. From the desert world of Arrakis (Dune) to the icy world of Hoth (Star Wars), examples are numerous. On present-day Earth, biomes are more diverse and complex than in fictitious universes. Yet, ice is thought to have covered much of Earth's surface a couple times between 750 million and 600 million years ago, and each time during a few million years (for comparison, Earth is 4.6 billion years old and modern humans have been around for a mere 100 thousand years). But we still do not fully understand what caused these "snowball Earth" episodes.
In this recent paper in Nature Geoscience, Georg Feulner and coauthors propose a new explanation for a glaciation that occurred from 717 to 662 million years ago: the spread after 800 million years ago of oceanic algae that favour the formation of clouds. After dying, these algae release very fine particules in the atmosphere. These particules, or aerosols, are essential for the condensation of the tiny drops of water that form clouds. More particules implies smaller drops, and with smaller drops clouds better reflect sun light and live longer before raining out. Using computer simulations of past climate where algal aerosols quantities are increased, Feulner showed that Earth's surface cools down because more sun light is reflected back to space by clouds, to the point where a snowball event occurs.
This study proposes a probable explanation for a global glacial event, even though more work is necessary to confirm it (this is how science works!). Importantly, it highlights the tight relationship there is between life and climate.
Farid Ait Chaalal, Sep 6, 2015
Reference: Georg Feulner, Christian Hallmann & Hendrik Kienert, 2015. Snowball cooling after algal rise. Nature Geoscience 8, 659-662. http://www.nature.com/.../ngeo2523.html
|
|
On the Perception of Climate
|
|
In his paper "Influence of Science Communication on Indigenous Climate Change Perception: Theoretical and Practical Implications", Peter Rudiak-Gould from the Oxford University shows that the population of the capital of the Marshall Islands perceive the effects of climate change by their own observation of the environment but that science communication is also influencing them. The results of a survey shows that observation moderately influence the report of environmental changes, such as increased temperatures, decreased rainfall and major erosion of the coast by the inhabitants of Majuro. On the other hand, the exposition to scientific discourse on climate change appears to affect importantly how people report those changes. This study therefore illustrates that although the population is able to see by itself the effects of climate change without knowing the scientific basis, communication is also influencing climate change perception and therefore direct dialogue between scientists and citizens should be developed.
Marie Charrière, Aug 29, 2015
Reference: Peter Rudiak-Gould, 2013. The Influence of Science Communication on Indigenous Climate Change Perception: Theoretical and Practical Implications. Human Ecology, 21, 1, 75-86. http://link.springer.com/.../10.1007%2Fs10745-013-9605-9
|
|
The impact of a possible future solar minimum on climate
|
|
Some of you may have heard of the possible impact of the solar variability on Earth's climate. As the (practically) only source of external energy for our planet, it is logical to suppose that a variation in its luminous output, even if very small, should have an impact on our climate. In fact, it is already well known that the variability in the ultraviolet light emitted by the Sun has an important influence on the upper and middle atmosphere's chemistry. But what about the lower atmosphere, where climate is defined, the surface, and even the oceans? The effects are much more difficult to highlight in that case given their weak amplitude and the presence of natural variability. However, more complete models and more powerful computers have allowed scientists to simulate these effects with increased precision and accuracy.
During the past decade, the solar cycle, which is responsible for the variation in our star's luminous output, has shown clear signs of weakening, so much that scientists have started to speculate about the possibility of entering a new "grand solar minimum" (Lockwood et al. 2010, Proc. R. Soc. A 466:303). These periods of reduced magnetic activity, which typically last for a few decades, happen more or less periodically and are suspected to be responsible for some climate anomalies on Earth (Gray et al. 2010, Rev. Geophys. 48: RG4001), the most famous probably being the "Little Ice Age" in Europe, whose deepest part coincided with the solar "Maunder Minimum". The authors of a study recently published in Nature explored the possibility that entering a new prolongated solar minimum could cancel out the effect of human-induced climate change. Unfortunately, even in the most optimistic scenario, it would only slow down the global warming, with global mean temperatures that would rise again after the return of normal solar magnetic activity.
Cassandra Bolduc, Aug 27, 2015
Reference: Ineson S. et al., 2015. Regional climate impacts of a possible future grand solar minimum. Nature Communications 6, Article number: 7535 http://www.nature.com/.../ncomms8535.html
|
|
"Weather" in the ocean
|
|
Are you wondering what is oceanic "weather"? It is ubiquitous from tropical to polar regions and consists in circular currents of water that we call eddies. A bit like clouds show atmospheric weather from space, the colors of plankton can show oceanic weather (here is an example: http://tinyurl.com/o5gnjus)
To study climate, scientists use computers to simulate the atmosphere, the ocean and of how the atmosphere and the ocean influence each other. Because their power is limited, computers can only simulate phenomena that are large enough. Atmospheric weather systems, like storms, are big enough but oceanic eddies, ten to one hundred times smaller, are not. Hence, computers "see" atmospheric weather systems quite well but oceanic eddies very roughly.
How does this affect the accuracy of computer simulations of the climate? Researchers at NOAA (www.noaa.gov) and Princeton University (www.princeton.edu) were among the first to answer this question (http://tinyurl.com/oug3jto). They compared a simulation with very coarse oceanic eddies to an other simulation with well-resolved ones. Interestingly, they observed that a high-definition ocean yields a more realistic atmosphere when compared to climate datas. For example, the patterns and quantities of tropical rain are better captured. This illustrates how important ocean currents are to the climate we experience on continents. Simulations of oceanic weather are incredibly beautiful as can be seen on this video (http://tinyurl.com/nl8dmdd): enjoy!
Farid Ait Chaalal, Aug 25, 2015
|
|
Do you have a question about a 3 Minutes Digest post or do you have a question related to climate? Then please contact us.
|
|
Thank you ClimateSnack!
|

|
During our Crowdfunding campaign, the Climatesnack group supported us and send a picture with the following comment via Facebook: "The Climatesnack group at Bergen Univeristy's Geophysics Institute shouting some big support out to Climanosco". A huge thank you for their wonderful support! We wish them good luck for their SciSnack Launch! |
|
Featuring our Members |

|
Marie Charrière
Hello! My name is Marie and I am part of the Board of Directors of Climanosco! I come from Switzerland but I am now living in the Netherlands. I am a geoscientist by training and I am in the process of completing my PhD at the Delft University of Technology. For the last 4 years, I have been studying the effect of risk communication on the population's awareness of natural hazards. During this period, I soon realized that this topic, as long as climate change, is not always very well understood by people. But this is normal in a way: scientific information is usually complex and scholars are not always very good at communicating their science! To contribute to change this, I joined Climanosco! This platform is the place where non-scientists people can access scientific information that is easy to understand! But I also hope that Climanosco will serve as a tool for science-society dialogue where anyone can say what type of climate research should be conducted! So if you have an idea about a topic that climate scientists could study, if you want to understand better climate science or if, as scientist, you want to share your work with anyone on the planet, join Climanosco!
|

|
Michel Bourqui
Hi, I am Michel, the founder of Climanosco! I have been engaged in research in atmospheric sciences for 15 years at universities in Switzerland, UK and Canada. During these years, I have been struck by the lack of connection between the scientific world and the world we live in. This lack of connection has so far left most people around the world short of understanding on climate, despite a strong presence on the international scene, increasing impacts and our increasing scientific knowledge. But science evolves in a very complex manner through small and big steps at many research institutions at the same time. Its ideas and results are always again revisited, re-explored and re-evaluated by working climate scientists. I believe that only these climate scientists who work every day on developing this knowledge can reflect this knowledge in a faithful manner and in its diversity, breadth and depth. For this to happen, we need to develop a community, which works together at shifting the old paradigm and at making this knowledge accessible in a sound, accessible and creative manner. Several initiatives are currently emerging here and there in this direction. Climanosco is joining forces, unique of its kind, tackling the challenge one step at a time.
|

|
Claudia Mignani
Hi, my name is Claudia and I am a "Summerpreneur" at Climanosco. Organized by Impact HUB, Summerpreneurship is an internship with an education program that brings impact-driven start-ups and students who are looking for an exciting summer internship together. Originally from Luxembourg, I came to Switzerland to study Environmental Sciences with Major in Atmosphere and Climate at ETH in Zurich a couple of years ago. After finishing my studies, I was looking for the opportunity to gain experience in an early stage social enterprise with an inspiring idea where I can have a positive impact to the world. That brought me to Climanosco, where I have been working since the beginning of August 2015. With Climanosco I can contribute to the great idea that everyone can become knowledgeable to the fascinating field of Climate Sciences. My vision for Climanosco is that it will become a community that changes the lives of people allowing them not only to better understand Climate Sciences but also to have a whole lot of fun together.
|
|
Become a featured member as well and let us know about your background and your vision for Climanosco.
|
|