Reconstructing the evolution of the Gulf Stream system
By Levke Caesar, 25 September 2026
Research article
As one of its most important heat transport systems, the Gulf Stream system has a significant influence on the Earth’s climate. The system is predicted to weaken under global warming, and scientists have wondered for years whether this slowdown has already begun. As direct measurements of the system are rare, one has to look at indirect, so-called proxy data, to answer this question. One promising proxy data set of the Gulf Stream system is the sea surface temperatures of the North Atlantic: they are highly affected by the northward heat transport associated with the Gulf Stream system and reach back as far as 1870. And indeed, a unique region of cooling temperatures south of Greenland provides evidence that the system has weakened by about 15 percent since the middle of the 20th century. This is in line with the trends found in other proxy data like the grain sizes or the composition of coral shells found in ocean sediments, that all indicate that the Gulf Stream system in recent decades has been weaker than ever before in at least 1600 years.
Have you ever wondered why cities like Stockholm or Dublin are on average about ten degrees warmer in winter than Canadian cities like Montreal or Quebec, even though the latter lie about 1,000 kilometres further south?
One important reason is that the prevailing winds bring relatively mild Atlantic air towards western Europe, while eastern North America is more strongly influenced by cold continental air. But the ocean also plays an important role through the so-called Gulf Stream system [J.B. Palter, 2015], a huge network of ocean currents flowing in the Atlantic Ocean, one of which is the name-giving Gulf Stream. In this article, I use “Gulf Stream system” as an accessible term for the larger-scale Atlantic circulation scientists describe as the Atlantic Meridional Overturning Circulation, or AMOC. The name briefly describes the main properties of the system: It flows through the Atlantic in north-south (aka meridional) direction and is defined by an overturning of water masses, that is, it carries warm, saline surface waters from the South towards the subpolar North Atlantic and returns cold, deep water southwards. The amount of water turned over in this way is measured in Sverdrup, where 1 Sv equals 1 billion litres of water per second. The average strength of the Gulf Stream system is about 20 Sv, which equals about 100 times the amount carried by the world’s largest river, the Amazon.
Due to this massive exchange of warm and cold water the system transports up to more than one petawatt (1 with 15 zeros) of heat northward in the Atlantic [W.E. Johns et al., 2011]. For comparison, this equals the energy production of about one million nuclear power plants. Since some of this heat is released into the atmosphere and transported toward Europe by the westerly winds blowing over the North Atlantic, the Gulf Stream system exerts a major influence on Europe’s climate. But its climatic influence reaches far beyond Europe, also affecting temperatures, storms and rainfall patterns in other regions.
An important part of the Gulf Stream system is the formation of dense water in the northern North Atlantic: As the warm, saline waters of the Gulf Stream system flow North they are cooled by the atmosphere and thus become denser and heavier. If the water at the surface is denser than the water in the ocean layers below, it sinks. This vertical movement, driven by density differences, is called convection. Climate models predict that this process will slow down as a result of global warming leading to a significant weakening of the Gulf Stream system [W. Weijer et al., 2020]. There are multiple possible reasons for that: an increase of precipitation over the high-latitudes of the North Atlantic [S. Manabe and R.J. Stouffer, 1999], as well as melting of Arctic sea ice [W. Liu et al., 2019] and the Greenland Ice Sheet [J. Bamber et al., 2012] add freshwater to the northern Atlantic, lowering the salinity of the upper ocean. This, along with increased warming of the ocean surface, reduces the density of the upper water masses and therefore, suppresses deep convection.
But climate change is already in full swing: due to the emission of greenhouse gases the Earth has warmed on average by about 1 degree [IPCC, 2018]; within less than 20 years the multiyear sea ice in the Arctic has more than halved [R. Kwok, 2018]; and the Greenland Ice Sheet is losing mass at rates among the highest of the last 12,000 years [J.P. Briner et al., 2020]. All of this is affecting the Gulf Stream system. Scientists have therefore been wondering for years whether these ocean currents have already started to slow down – a question that can only be answered with measurement data.
To get this data, in 2004 an array of more than 190 instruments was deployed in the Atlantic at about 26°N [G.D. McCarthy et al., 2015], spanning its entire width (approx. 6,500 km) and providing measurement data on the Gulf Stream system on a daily basis [S.A. Cunningham et al., 2007].
These data show a reduction in strength of about 30% from April 2004 until April 2010 [D.A. Smeed et al., 2014], which is an extreme decrease. Since then, the current has recovered somewhat, but is still below the 2004 level [D.A. Smeed et al., 2018]. However, these data are not sufficient to assess whether the decrease is a result of man-made climate change and whether it represents a long-term trend; the measurement series is simply too short. This is because the Gulf Stream system – like many other components in the climate system – is subject to natural fluctuations. It is therefore quite normal that the currents sometimes flow more strongly, sometimes less strongly. To determine whether there is a longer-term weakening, correspondingly long time series are needed.
To assess the state of the Gulf Stream system for the period before 2004, we have to make do with so-called proxy data. Proxy data are climate data that provide indirect information about a system, e.g., tree rings can give information about the tree’s growth conditions, that is mainly temperature and precipitation, in the area where they grow.
In case of the Gulf Stream system, scientists look particularly at the ocean temperatures in the subpolar North Atlantic as proxy data. The advantages are that due to its large heat transport into this region the Gulf Stream system strongly influences its temperature, and measurement series for sea surface temperatures date back to 1870. However, the surface temperature of the water is also influenced by other factors, such as the temperature of the overlying air or local, small-scale current changes. The difficulty is to separate the temperature response to changes in the Gulf Stream system from the response to other influencing factors.
To do so, colleagues and I used a high-resolution climate model that simulates the response of the sea surface temperatures in the North Atlantic to a weakening of the Gulf Stream system. In the simulation the carbon dioxide concentration in the atmosphere was doubled over the course of 70 years, leading to a warming of the Earth of about 3 degrees and a weakening of the Gulf Stream system of about 25 percent.
The model shows that the warming does not happen uniformly; some regions warm more, others less, than the global average. The greatest deviations are found in the North Atlantic: while a narrow area along the US east coast has warmed more than three times as much as the global average, a region south of Greenland that is more than half the size of the US shows virtually no warming and at some places is even cooling. The latter is also referred to as the North Atlantic “cold blob”. This dipole pattern of particularly strong and almost no warming is directly related to the weakening of the Gulf Stream system simulated in the model: The significantly reduced northward heat transport in the Atlantic leads to a cooling of the region south of Greenland, counterbalancing the global warming signal. The particularly strong warming along the coast between North Carolina and Newfoundland is due to the warm water masses of the actual Gulf Stream, which shifts northward as the Gulf Stream system weakens. Therefore, this pattern is a kind of “fingerprint” in the sea surface temperatures of a weakening Gulf Stream system [L. Caesar et al., 2018].
An examination of the observed sea surface temperatures since 1870 shows that they contain the same fingerprint. Here, too, the region south of Greenland has warmed significantly less than the rest of the world – or even cooled – and here, too, the waters along the North American east coast have warmed significantly more (Figure 1).
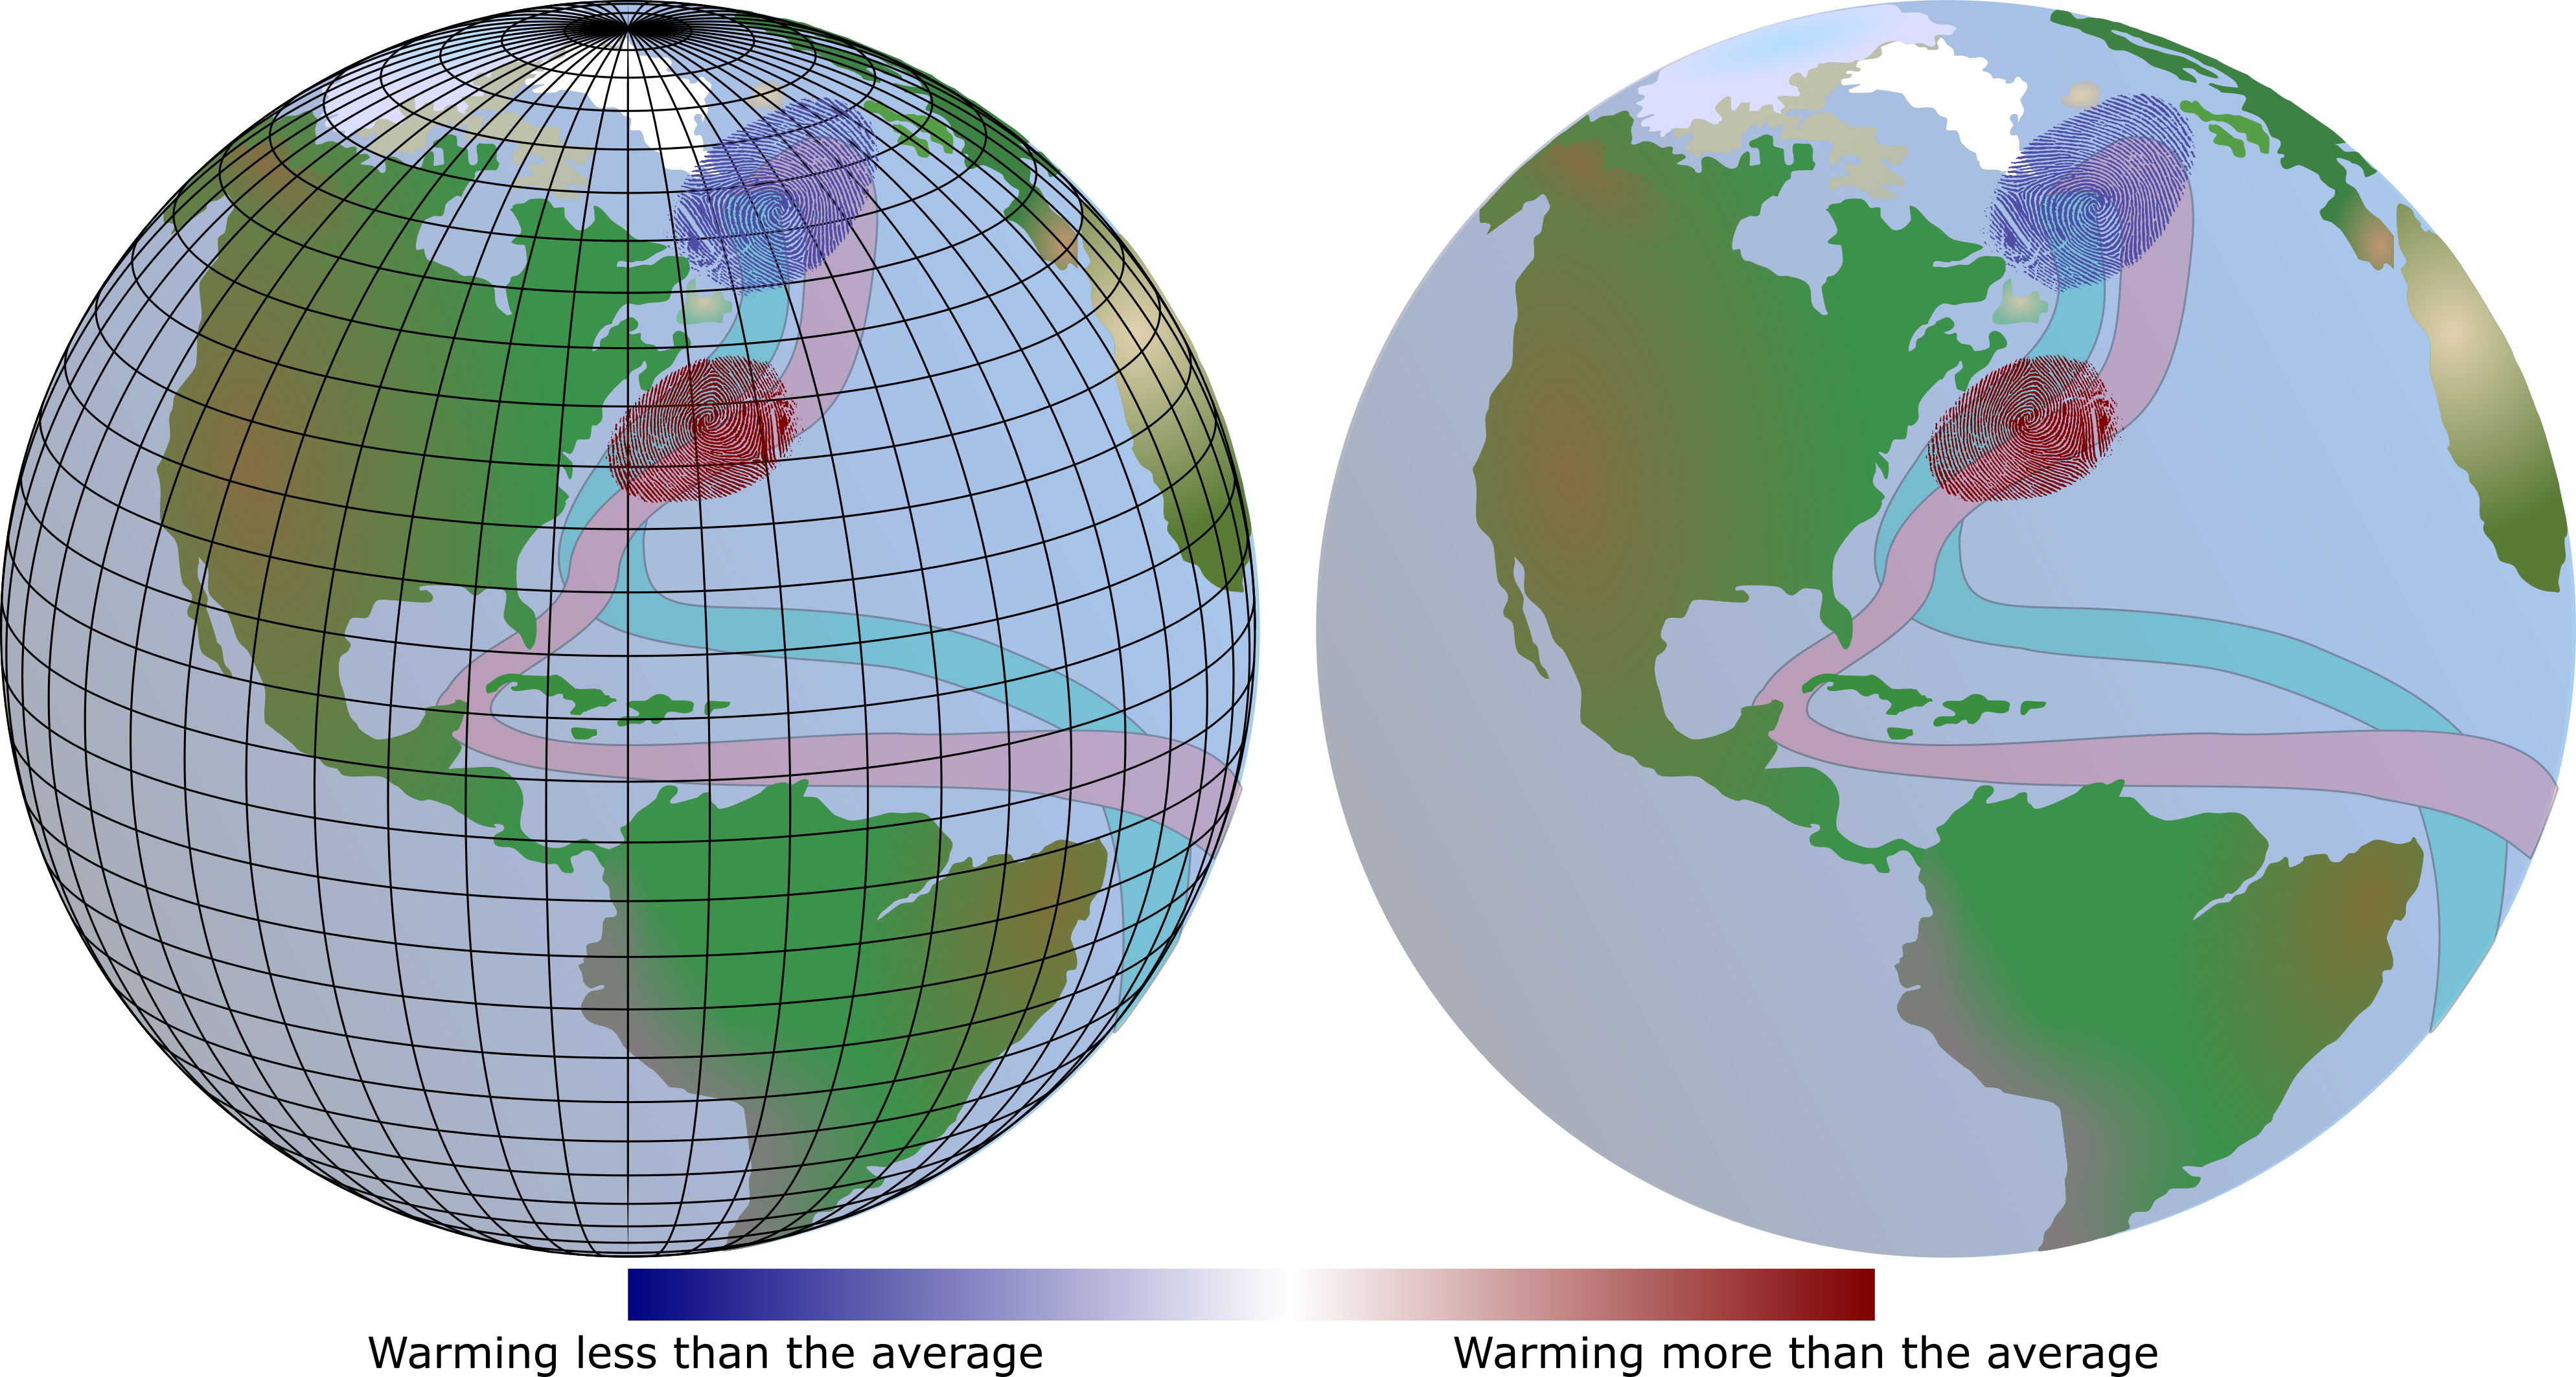
Figure 1. We identified a distinct fingerprint of a slower Gulf Stream System in the sea surface temperature evolution in a climate model (left) which we have also found in the observed temperatures (right). The path of the Gulf Stream system’s upper (red) and lower (cyan) branch are schematically shown.
Using these findings, we estimated the temporal evolution of the Gulf Stream system by determining the strength of the North Atlantic cold blob, i.e., we looked for each year how much colder, or warmer, this region was compared to the global mean sea surface. To convert this relative temperature into an actual current strength we studied the relationship between cold blob and Gulf Stream system in a series of climate models. These showed that a reduction of the Gulf Stream system of 1 Sverdrup cools the region south of Greenland on average by about 0.25 degrees. With this conversion factor we were able to reconstruct a time series of the Gulf Stream system that starts in 1870. The time series shows that while the system has been fairly stable over the first part of the 20th Century it indeed started to decline around 1960. And while a short-lived recovery is evident in the 1990s, a further decline starting in 2004 led to the Gulf Stream system being now about 3 Sv (or 15 percent) weaker compared to the first half of the 20th Century (Figure 2 black line).
What is special about this reconstruction is that it combines the seemingly contradictory results of previous studies. For example, in 2005 a team led by British scientist Harry Bryden published a study based on single ship measurements, that were taken in 1957, 1981, 1992, 1998 and 2004, concluding that the Gulf Stream system had weakened by about 30 percent during that time [H.L. Bryden et al., 2005]. The results were criticized for two reasons: On the one hand, it was noted that the natural fluctuations of the Gulf Stream system were not taken into account. Additionally, the direct measurements that were taken since 2004 revealed that the Gulf Stream system flows strongest in autumn and reaches its roughly 30 percent reduced minimum strength in spring [T. Kanzow et al., 2010].
As the single ship measurements were taken during different times of the year, they were not directly comparable. If the shipboard measurements are corrected for the seasonal cycle, they only show a weakening of about 13 percent [T. Kanzow et al., 2010] (Figure 2 green box). Another team around meteorologist Mojib Latif, which analysed measurements of ocean density between Greenland and Iceland, concluded that the current system has actually increased in strength from 1970 until 2000 [M. Latif et al., 2006] (Figure 2 red box).
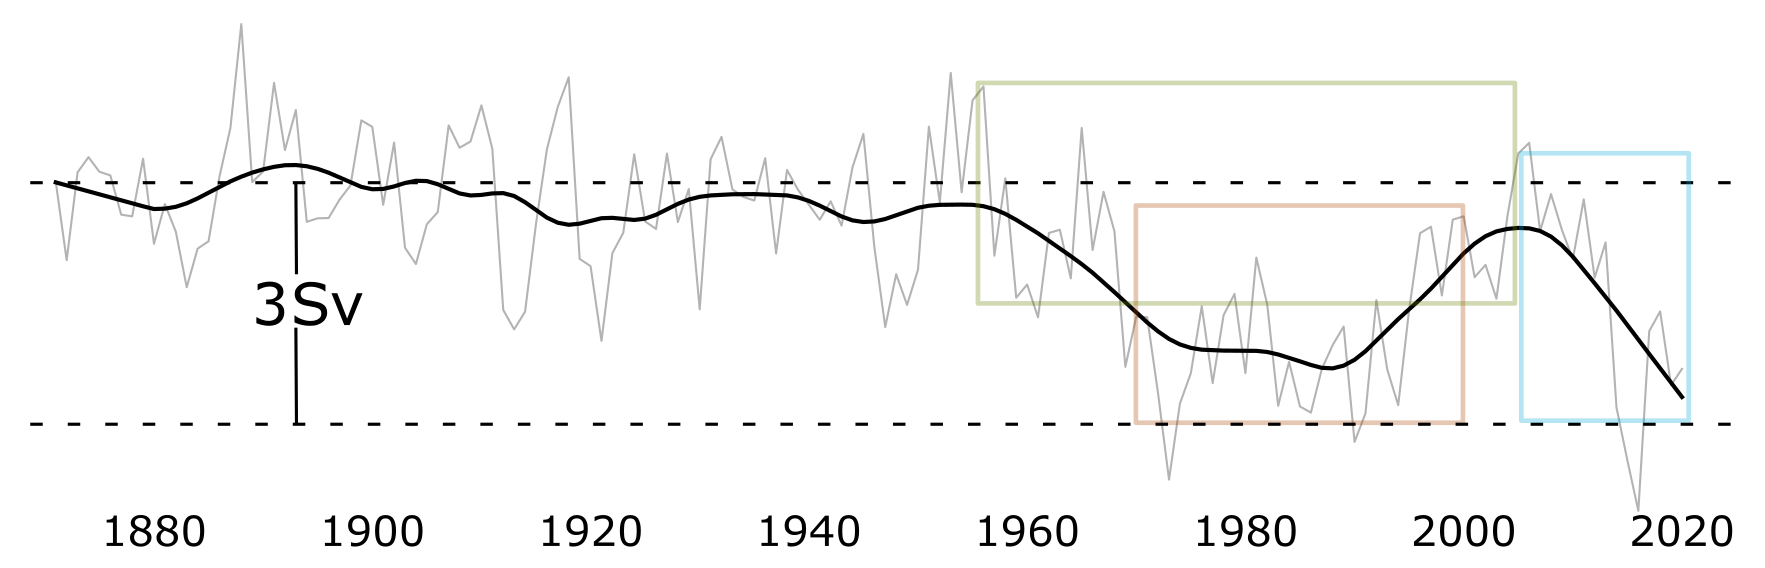
Figure 2. Shown is the evolution of the Gulf Stream system as reconstructed from the sea surface temperatures in the North Atlantic. The thick black line shows the longer-term evolution (for more details see [L. Caesar et al., 2018]), the thin line shows the annual values. The boxes mark the time periods of a decrease based on single year ship measurements (green), an increase based on density measurements (red) and the time period of the direct measurements (blue).
Our results indicate that all previous studies are correct and that the difference arose from the consideration of different time periods combined with the fact that the evolution of the Gulf Stream system consists of a long-term weakening superimposed by natural variations. The fact that the sea surface temperature based reconstruction is furthermore capable of capturing the strong decrease measured from 2004-2010 as well as the subsequent slight recovery (Figure 2 blue box) reinforces our confidence that ocean temperatures in the subpolar North Atlantic are indeed well suited for estimating the long-term changes in the Gulf Stream system.
In a continuing study, colleagues and I have put the 20th Century decrease in an even broader context: By comparing a variety of different proxy data of the Gulf Stream system, some of which reach back as far as AD 400, we found consistent evidence that the Gulf Stream system over the last decades has been weaker than any time before in the last 1600 years [L. Caesar et al., 2021]. The advantage of using different kinds of proxy data is that as they are all linked to the Gulf Stream system in different ways, they are subject to different uncertainties. If they nevertheless show a common behaviour, it largely increases our confidence that the signal that we see is indeed representative of the Gulf Stream system. The proxy data that we considered include for example a data set that describes the size of the grains in an ocean sediment core taken from a place where the deep return current of the Gulf Stream system flows.
This tells us something about its strength as a faster current can transport large grains and we see that the transported grains got smaller over the last 200 years [D.J.R. Thornalley et al., 2018] indicating a slowing of the current. Another data set contained the composition of coral shells near Iceland. How corals build their shells depends on the water temperature and this data set showed a shift in the water conditions in recent decades, indicating a major change in the ocean circulation [P.T. Spooner et al., 2020]. All in all, we looked at eleven different data sets that all indicated that the Gulf Stream system has gotten weaker over the course of the last one to two hundred years, and that both the rate of the slowdown as well as the current low state are unprecedented in this time period [L. Caesar et al., 2021].
While we did not investigate the causes of this recent slowdown, climate models predict that as a result of global warming, the Gulf Stream system will weaken by more than 30 percent over the course of the 21st Century [W. Weijer et al., 2020]. The full list of consequences of this slowdown is still unknown, but already identified impacts include an enhanced sea-level rise at the US east coast [T. Ezer, 2015], increased storminess in north-western Europe [L.C. Jackson et al., 2015] and an increased risk of drought in the Sahel region [D. Defrance et al., 2017]. Furthermore, the continued slowdown will get us closer to a tipping point of the Gulf Stream system, a point after which the full collapse of the system is inevitable and possibly irreversible [T.M. Lenton et al., 2008]. As the threshold at which such a tipping point would be reached is poorly known [M.W. Buckley and J. Marshall, 2016], given the importance of the Gulf Stream system, it seems a foolish thing to risk.
| [1] | J. Bamber, M. van den Broeke, J. Ettema, J. Lenaerts and E. Rignot: Recent large increases in freshwater fluxes from Greenland into the North Atlantic, Geophysical Research Letters, vol. 39, https://doi.org/10.1029/2012GL052552, 2012. |
| [2] | J.P. Briner, J.K. Cuzzone, J.A. Badgeley, N.E. Young, E.J. Steig, M. Morlighem, N.-J. Schlegel, G.J. Hakim, J.M. Schaefer and co-authors: Rate of mass loss from the Greenland Ice Sheet will exceed Holocene values this century, Nature, vol. 586, 70-74, https://doi.org/10.1038/s41586-020-2742-6, 2020. |
| [3] | H.L. Bryden, H.R. Longworth and S.A. Cunningham: Slowing of the Atlantic meridional overturning circulation at 25° N, Nature, vol. 438, 655-657, https://doi.org/10.1038/nature04385, 2005. |
| [4] | M.W. Buckley and J. Marshall: Observations, inferences, and mechanisms of the Atlantic Meridional Overturning Circulation: A review, Reviews of Geophysics, vol. 54, 5-63, https://doi.org/10.1002/2015RG000493, 2016. |
| [5] | L. Caesar, G.D. McCarthy, D.J.R. Thornalley, N. Cahill and S. Rahmstorf: Current Atlantic Meridional Overturning Circulation weakest in last millennium, Nature Geoscience, vol. 14, 118-120, https://doi.org/10.1038/s41561-021-00699-z, 2021. |
| [6] | L. Caesar, S. Rahmstorf, A. Robinson, G. Feulner and V. Saba: Observed fingerprint of a weakening Atlantic Ocean overturning circulation, Nature, vol. 556, 191-196, https://doi.org/10.1038/s41586-018-0006-5, 2018. |
| [7] | S.A. Cunningham, T. Kanzow, D. Rayner, M.O. Baringer, W.E. Johns, J. Marotzke, H.R. Longworth, E.M. Grant, J.J.M. Hirschi and co-authors: Temporal Variability of the Atlantic Meridional Overturning Circulation at 26.5°N, Science, vol. 317, 935, https://doi.org/10.1126/science.1141304 , 2007. |
| [8] | D. Defrance, G. Ramstein, S. Charbit, M. Vrac, A.M. Famien, B. Sultan, D. Swingedouw, C. Dumas, F. Gemenne and co-authors: Consequences of rapid ice sheet melting on the Sahelian population vulnerability, Proceedings of the National Academy of Sciences, vol. 114, 6533-6538, https://doi.org/10.1073/pnas.1619358114, 2017. |
| [9] | T. Ezer: Detecting changes in the transport of the Gulf Stream and the Atlantic overturning circulation from coastal sea level data: The extreme decline in 2009–2010 and estimated variations for 1935–2012, Global and Planetary Change, vol. 129, 23-36, https://doi.org/10.1016/j.gloplacha.2015.03.002, 2015. |
| [10] | IPCC: Summary for Policymakers, in: Global Warming of 1.5°C. An IPCC Special Report on the impacts of global warming of 1.5°C above pre-industrial levels and related global greenhouse gas emission pathways, in the context of strengthening the global response to the threat of climate change, sustainable development, and efforts to eradicate poverty, V. Masson-Delmotte, P. Zhai, H.-O. Pörtner, D. Roberts, J. Skea, P.R. Shukla, Pirani, Moufouma-Okia W., Péan C. and co-editors (Eds.). World Meteorological Organization, Geneva, Switzerland, 32, 2018. |
| [11] | L.C. Jackson, R. Kahana, T. Graham, M.A. Ringer, T. Woollings, J.V. Mecking and R.A. Wood: Global and European climate impacts of a slowdown of the AMOC in a high resolution GCM, Climate Dynamics, vol. 45(11), 3299-3316, https://doi.org/10.1007/s00382-015-2540-2, 2015. |
| [12] | W.E. Johns, M.O. Baringer, L.M. Beal, S.A. Cunningham, T. Kanzow, H.L. Bryden, J.J.M. Hirschi, J. Marotzke, C.S. Meinen and co-authors: Continuous, Array-Based Estimates of Atlantic Ocean Heat Transport at 26.5°N, Journal of Climate, vol. 24(10), 2429-2449, https://doi.org/10.1175/2010JCLI3997.1, 2011. |
| [13] | T. Kanzow, S.A. Cunningham, W.E. Johns, J.J.M. Hirschi, J. Marotzke, M.O. Baringer, C.S. Meinen, M.P. Chidichimo, C. Atkinson and co-authors: Seasonal Variability of the Atlantic Meridional Overturning Circulation at 26.5°N, Journal of Climate, vol. 23(21), 5678-5698, https://doi.org/10.1175/2010JCLI3389.1, 2010. |
| [14] | R. Kwok: Arctic sea ice thickness, volume, and multiyear ice coverage: losses and coupled variability (1958–2018), Environmental Research Letters, vol. 13(10), 105005, https://doi.org/10.1088/1748-9326/aae3ec, 2018. |
| [15] | M. Latif, C. Böning, J. Willebrand, A. Biastoch, J. Dengg, N. Keenlyside, U. Schweckendiek and G. Madec: Is the Thermohaline Circulation Changing?, Journal of Climate, vol. 19(18), 4631-4637, https://doi.org/10.1175/JCLI3876.1, 2006. |
| [16] | T.M. Lenton, H. Held, E. Kriegler, J.W. Hall, W. Lucht, S. Rahmstorf and H.J. Schellnhuber: Tipping elements in the Earth’s climate system, Proceedings of the National Academy of Sciences of the United States of America, vol. 105(6), 1786-1793, https://doi.org/10.1073/pnas.0705414105, 2008. |
| [17] | W. Liu, A. Fedorov and F. Sévellec: The Mechanisms of the Atlantic Meridional Overturning Circulation Slowdown Induced by Arctic Sea Ice Decline, Journal of Climate, vol. 32(4), 977-996, https://doi.org/10.1175/JCLI-D-18-0231.1, 2019. |
| [18] | S. Manabe and R.J. Stouffer: The rôle of thermohaline circulation in climate, Tellus A, vol. 51(1), 91-109, https://doi.org/10.1034/j.1600-0870.1999.t01-1-00008.x, 1999. |
| [19] | G.D. McCarthy, D.A. Smeed, W.E. Johns, E. Frajka-Williams, B.I. Moat, D. Rayner, M.O. Baringer, C.S. Meinen, J. Collins and co-authors: Measuring the Atlantic Meridional Overturning Circulation at 26°N, Progress in Oceanography, vol. 130, 91-111, https://doi.org/10.1016/j.pocean.2014.10.006, 2015. |
| [20] | J.B. Palter: The Role of the Gulf Stream in European Climate, Annual Review of Marine Science, vol. 7(1), 113-137, https://doi.org/10.1146/annurev-marine-010814-015656, 2015. |
| [21] | D.A. Smeed, S.A. Josey, C. Beaulieu, W.E. Johns, B.I. Moat, E. Frajka-Williams, D. Rayner, C.S. Meinen, M.O. Baringer and co-authors: The North Atlantic Ocean Is in a State of Reduced Overturning, Geophysical Research Letters, vol. 45(3), 1527-1533, https://doi.org/10.1002/2017GL076350, 2018. |
| [22] | D.A. Smeed, G.D. McCarthy, S.A. Cunningham, E. Frajka-Williams, D. Rayner, W.E. Johns, C.S. Meinen, M.O. Baringer, B.I. Moat and co-authors: Observed decline of the Atlantic meridional overturning circulation 2004-2012, Ocean Science, vol. 10, 29-38, https://doi.org/10.5194/os-10-29-2014, 2014. |
| [23] | P.T. Spooner, D.J.R. Thornalley, D.W. Oppo, A.D. Fox, S. Radionovskaya, N.L. Rose, R. Mallett, E. Cooper and J.M. Roberts: Exceptional 20th Century Ocean Circulation in the Northeast Atlantic, Geophysical Research Letters, vol. 47(10), e2020GL087577, https://doi.org/10.1029/2020GL087577, 2020. |
| [24] | D.J.R. Thornalley, D.W. Oppo, P. Ortega, J.I. Robson, C.M. Brierley, R. Davis, I.R. Hall, P. Moffa-Sanchez, N.L. Rose and co-authors: Anomalously weak Labrador Sea convection and Atlantic overturning during the past 150 years, Nature, vol. 556(7700), 227-230, https://doi.org/10.1038/s41586-018-0007-4, 2018. |
| [25] | W. Weijer, W. Cheng, O.A. Garuba, A. Hu and B.T. Nadiga: CMIP6 Models Predict Significant 21st Century Decline of the Atlantic Meridional Overturning Circulation, Geophysical Research Letters, vol. 47(12), e2019GL086075, https://doi.org/10.1029/2019GL086075, 2020. |
