Choose you own scientific experiment: Triggering debris flows and flash floods
By Thea Turkington, 3 September 2016
Research article
Landslides and flash floods result in many fatalities around the globe. Understanding what triggers these events is therefore vital, although how to approach this problem is not straight forward. After background information for the experiment and some guidelines, two options are presented to learn more about the triggers of debris flows: (A) using rainfall or (B) the atmospheric conditions. You can then choose the option that appears more useful and interesting to you (you can always go back and read the other experiment afterwards). The article then ends with a reflection on the results.
Background
Sitting beside the Faucon torrent, you enjoy the cool mountain breeze. You hiked up here after lunch, as you have recently moved to this region in the South East French Alps and wanted to explore the area. You notice that the surrounding mountain peaks, visible when you started out, are now capped with fluffy, marshmallow-like clouds. There is little snow around you at the moment, but you think about the coming winter when the valley will be shrouded in snow, perfect conditions for winter activities. To get a better look down at the Ubaye Valley, you move away from the torrent. You notice, however, the previously innocent looking clouds are growing to a rather monstrous size, and the cool breeze has turned much stronger. Rain begins to fall, although from what you can see, it appears much heavier further up the mountain. A dull roar builds from the direction of the torrent. Pausing, you turn your head towards the noise. Suddenly a mass of … what is that, water?… rushes downstream. It is not like the normal water however. It is dirty, sludgy, and contains rocks, damaging houses along the way. You hurry back towards the residential area below to see if you can help.
When you arrive, you talk to the locals and find that thankfully no one was hurt(1). Somewhat concerning is that you hear this sort of thing had happened before. Every year or so, this phenomenon occurs somewhere in the area, either here or other torrents in the valley [1]. In some instances, it is only water, termed a ‘flash flood’. In other instances, rocks, dirt, and other sediment are mixed in with the water, resulting in a ‘debris flow’. With a bit more probing, you discover that previous research found that these debris flows and flash floods (or ‘flash events’), have previously been associated with melting snow and high-intensity storms [1]. Will this continue in the future?
You know that the climate is changing. Warmer temperature may reduce the amount of snow, possibly reducing the number of flash events, although warmer temperatures may lead to more high-intensity rainfall events so the number may actually increase [2]. You decide to investigate further to see if you can find a link between the climate and these flash events. Maybe in doing so, you can use your results as part of an early warning system, or to better understand how the number of flash events may change in the future. Or perhaps even in other areas people can use your experiment set up to see what is happening in their own region. First however, you have to establish a link.
Start of the experiment
You decide to look for thresholds. The goal of a threshold is to divide days when an event occurs, like a flash event, from the days that they do not occur (which in this experiment is many days, as most days there are no debris flows or flash floods). Thresholds are often used as part of early warning systems, such as in the example of rainfall warnings where a warning is given out when the rainfall amount exceeds a threshold.
Data for the Ubaye Valley is available from 1979 to 2010. Part of the data will be used to develop the threshold: 1989-2004 (termed the calibration period as this is the data used to form or calibrate the threshold). On either side, you have two validation periods: 1979-1998 and 2005-2010. The data from these two validation periods will be used to test your thresholds from the calibration period. If the threshold still does a good job separating the events in the validation period, the threshold works. Otherwise, it will be back to the drawing board. Now you just have to decide what data you will use.
One option is to use rainfall measurements. Rainfall is what you think is actually triggering the debris flows, and there are four measuring stations located near the main river (rain gauges). You have daily measurements of how much rain fell for the entire calibration and validation periods.
Another option is to look to the atmosphere to see what is causing the rainfall (atmospheric conditions). You realize that every time it rains, a flash event does not occur. And there is data available for many different atmospheric properties covering all of Europe for both your calibration and validation periods.
If you decide to use rainfall measurements, proceed to experiment A. If you decide to branch out and take the less obvious path and use atmospheric conditions, proceed to experiment B.
Experiment A
You decide to stick with rainfall. You know that this is a typical approach when considering debris flows around the world (e.g. [3], [4], [5]). These rainfall thresholds are typically based on the intensity and duration of the rain, and in some cases how much rain fell in the preceding days [6]. While ideally you would like to use records of how much rainfall fell every hour, you only have daily data. So you test a variety of rainfall parameters (1 day and 10 days together, 1 day by itself, 2 days and 7 days together etc.) using statistics to see what threshold and combination works best.
You find that the best parameters are daily rainfall combined with rainfall over the preceding four days from a rain gauge sitting in the middle of the catchment. More rainfall in the four days before the flash event means that when the heavy rainfall arrives, not much water can be absorbed into the ground, and will therefore more likely lead to a flash event. The threshold works well in the calibration period – most of the values are above the threshold. While some of the non-flash days are above the threshold too, most are below. So far so good. When looking at the validation periods however, most of the flash events are below the threshold – not so good. Although you do not get too disheartened, as similar results were found in other studies too (e.g. [4]).
You start to wonder about using rainfall for your threshold. You think back to the day on the Faucon torrent when you witnessed the debris flow. It wasn’t raining that hard where you were standing, and maybe this was also true for the rain gauge. You also remember the sunny weather in the morning. All the rain fell in a short time, and perhaps the debris flow would not have occurred if the rain had been spread out over the entire day. So maybe this event was actually one of the days below the threshold! You wonder if you would have had better results with experiment B.
Experiment B
You decide to take the unusual route of using atmospheric conditions. If there was a simple relationship between rainfall and debris flows, it may have already been found by now. And in the process of developing the threshold, maybe you will learn a bit more about what is actually causing the rainfall. But which atmospheric properties to use?
You brush up on some previous studies. Back in the 1970s, [7] found that just under half of the flash floods in the United States were caused by thunderstorms that developed locally (local convection). In contrast, the other flash floods were associated with large scaler weather features, such as cold fronts and low pressure systems. Fast forward to 2010s, [8] used the distribution of low and high air pressure over Europe, combined with wind and a relative of temperature (the technical term is adiabatic wet-blub potential temperature) to identify heavy precipitation events. Numerous studies also used a variable called CAPE (e.g. [9], [10], [11]). CAPE stands for ‘Convective Available Potential Energy’, which is a measure of how much energy would you get if you took a small parcel of air near the surface and gave it a little upward nudge. If the air parcel flies high into the air, as in a thunderstorm, the CAPE values would be high. So you decide to use this variable CAPE (CAPE and flash events are starting to sound a bit like a super hero story, but nevertheless), along with other variables that you found in the other studies including temperature, wind, air pressure, and specific humidity (how much moisture is in the air).
You first split all your flash events into those where you think the rainfall was generated locally (most of the flash events), and those which you think are caused by large scale features like cold fronts. After testing the different variables, high CAPE and specific humidity near the mountain tops work best as a threshold for locally generated flash events. And this makes sense – high CAPE means all your air parcels will be very buoyant, and with lots of moisture, condensing to form rain or hail when they get high enough. For large scale events, specific humidity and temperature work as the best thresholds in the calibration period.
The results for the locally generated flash events work well. Most of the flash events are above the threshold in the calibration and validation periods. However, your large scale atmospheric flash events do not work so well. While most of the large scale flash events are above the threshold in the calibration period, only one of the 10 events are above the threshold in the validation periods. Maybe two variables are not enough for these events.
You start to wonder about using atmospheric conditions. You learnt that most of the flash floods and debris flows in the Ubaye Valley look to be caused by locally generated thunderstorms, just like you saw near the Faucon torrent. However, you could not find a good threshold for the other events. Furthermore, how easy would it be to use your results in an early warning system? Maybe it would have been better to use experiment A.
Reflection
You look back at your experiment (or experiments if you read both of them). It is not always a straightforward decision about what properties to use when trying to understand the triggers different natural hazards. And what worked in your area for the hazards you looked at (debris flows and flash floods), will not necessarily be the same for others. Using atmospheric variables can provide information about the mechanisms behind rainfall-triggered events, but this may not be as easy to interpret as just using rainfall, or as easy to incorporate into early warning systems. Therefore, rainfall thresholds may be better to use for early warning systems, but you would need to test them out with forecast data. Or if you decide to look at climate change, you could use the atmospheric thresholds to see how locally generated flash events change compared to the large scale ones. Either way, you go and put the kettle on, and start to think about which experiment you will start next.
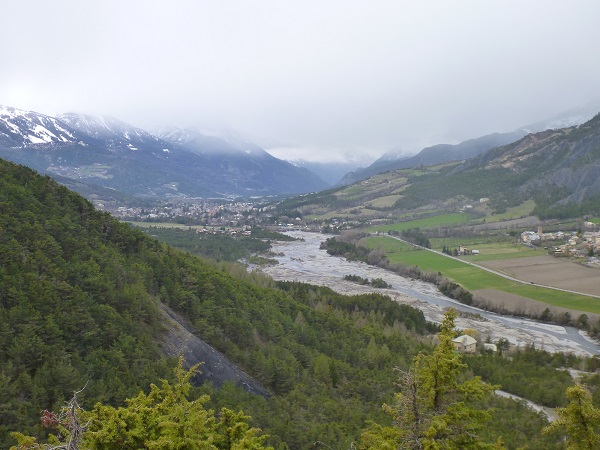
Figure 1: A view of the Ubaye Valley
| (1) | The description is loosely based on the August 2003 event in the Faucon torrent. As described above, no one was hurt during the event, although the cost was estimated to be 2.5 million euros. |
| [1] | J.-C. Flageollet, O. Maquaire, B. Martin and D. Weber: Landslides and climatic conditions in the Barcelonnette and Vars basins (Southern French Alps, France), Geomorphology, vol. 5, 3-17, 1999. |
| [2] | P. Pall, M. Allen and D. Stone: Testing the Clausius–Clapeyron constraint on changes in extreme precipitation under CO2 warming, Climate Dynamics, vol. 28, 351-363, 2007. |
| [3] | M. Jakob, T. Owen and T. Simpson: A regional real-time debris-flow warning system for the District of North Vancouver, Canada, Landslides, vol. 9, 165-178, 2012. |
| [4] | N. K. Meyer, A. V. Dyrrdal, R. Frauenfelder, B. Etzelmüller and F. Nadim: Hydrometeorological threshold conditions for debris flow initiation in Norway, Natural Hazards and Earth System Sciences, vol. 12, 15, 2012. |
| [5] | J. Zhuang, P. Cui, G. Wang, X. Chen, J. Iqbal, Guo and X.: Rainfall thresholds for the occurrence of debris flows in the Jiangjia Gully, Yunnan Province, China, Engineering Geology, vol. 195, 335-346, 2015. |
| [6] | F. Guzzetti, S. Peruccacci, M. Rossi and C. Stark: The rainfall intensity–duration control of shallow landslides and debris flows: an update, Landslides, vol. 5, 3-17, 2008. |
| [7] | R. A. Maddox, C. F Chappell and L. R. Hoxit: Synoptic and Meso-α Scale Aspects of Flash Flood Events 1, Bulletin of the American Meteorological Society, vol. 60, 115-123, 1979. |
| [8] | O. Nuissier, B. Joly, A. Joly, V. Ducrocq and P. Arbogast: A statistical downscaling to identify the large-scale circulation patterns associated with heavy precipitation events over southern France, Quarterly Journal of the Royal Meteorological Society, vol. 137, 351-363, 2011. |
| [9] | S. Niall and K. Walsh: The impact of climate change on hailstorms in southeastern Australia, International Journal of Climatology, vol. 25, 1933-1952, 2005. |
| [10] | R. Trapp, N. Diffenbaugh and A. Gluhovsky: Transient response of severe thunderstorm forcing to elevated greenhouse gas concentrations, Geophysical Research Letters, vol. 36, L01703, 2009. |
| [11] | D. M. Romps, J. T. Seeley, D. Vollaro and J. Molinari: Projected increase in lightning strikes in the United States due to global warming, Science, vol. 346, 851-854, 2014. |
